The Power of Dashboards in Revenue Assurance: Enhancing Visibility and Control with S-ONE RA

In the telecom industry billions of transactions occur every day, so ensuring accurate revenue capture and minimizing leakage is essential. Revenue Assurance (RA) teams play a critical role in this effort, relying heavily on actionable insights derived from data. Dashboards are central to this process, offering RA teams the ability to monitor, analyze, and act on key metrics in real-time. Here, we explore  the importance of dashboards in revenue assurance and provide a detailed breakdown of the essential dashboards S-ONE RA offers, the metrics they include, and their importance.

1. Revenue Trends Dashboard

Metrics Included:

  • Total revenue generated (daily, weekly, monthly)
  • Revenue breakdown by service (voice, SMS, data, roaming)
  • Anomalies in revenue trends
  • Comparison of projected vs. actual revenue

Why It’s Needed:

This dashboard provides a bird’s-eye view of revenue streams, allowing RA teams to monitor overall performance and detect irregularities quickly. Identifying revenue declines or unexpected spikes ensures that any underlying issues, such as system misconfigurations or fraudulent activities, are addressed promptly.

2.Data Reconciliation Dashboard

Metrics Included:

  • Volume of reconciled vs. unreconciled call detail records (CDRs)
  • Data reconciliation success rates
  • Discrepancies between network records and billing systems
  • Mediation system logs for dropped or rejected records

Why It’s Needed:

Accurate reconciliation of data ensures that all usage is billed correctly. This dashboard helps RA teams identify gaps in data processing, such as missed CDRs, and fix  issues before they impact revenue. By highlighting reconciliation discrepancies, the dashboard minimizes revenue leakage.

3. Fraud Detection Dashboard
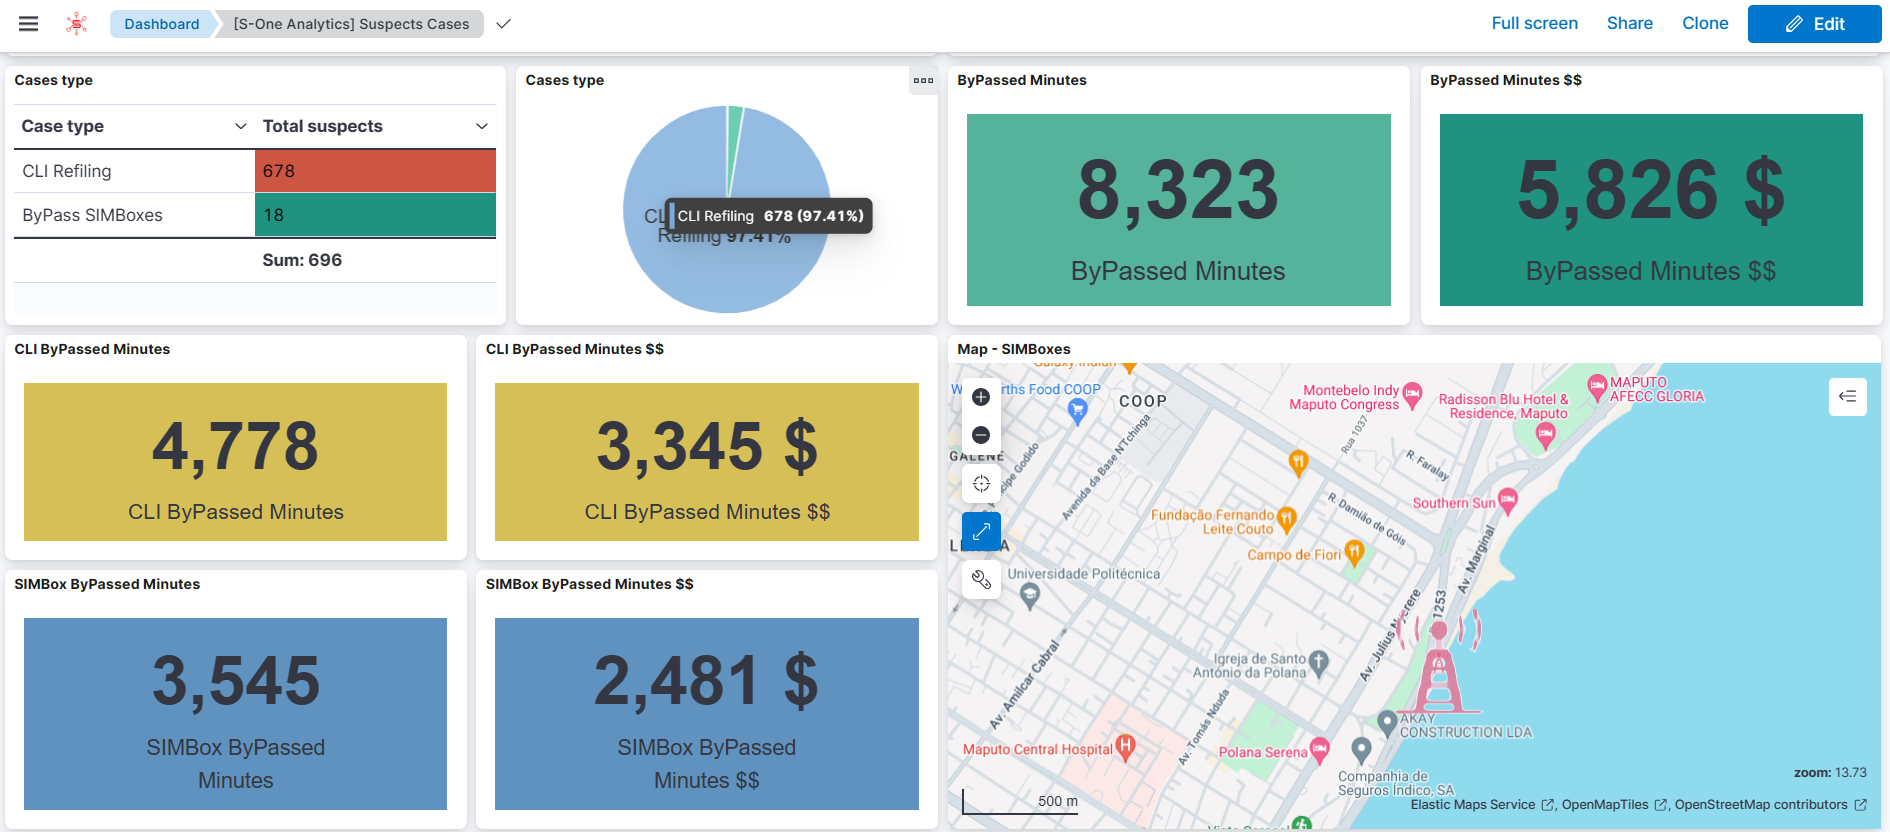
Metrics Included:

  • Number of flagged fraud events
  • Types of fraud detected (e.g., Simbox bypass,CLI bypass fraud)
  • Locations and timestamps of suspicious activities
  • Revenue impact of identified fraud

Why It’s Needed:

Fraudulent activities pose significant threats to revenue. This dashboard provides real-time alerts and detailed analyses of fraud patterns, enabling RA teams to take swift action to mitigate risks. It also helps in evaluating the effectiveness of anti-fraud measures over time.

4. Interconnect and Roaming Revenue Dashboard

Metrics Included:

  • Revenue from interconnect agreements
  • Roaming revenue breakdown by partner and region
  • Settlement discrepancies with partner operators
  • Trends in interconnect and roaming traffic

Why It’s Needed:

Revenue from interconnect and roaming agreements can be complex to manage. This dashboard ensures accurate tracking and settlement of revenue with partner operators. By identifying discrepancies in real-time, RA teams can avoid disputes and recover potential losses effectively.

5. Customer Complaint Analysis Dashboard

Metrics Included:

  • Volume of billing-related complaints
  • Average resolution time for disputes
  • Financial impact of resolved and unresolved complaints
  • Trends in complaint categories

Why It’s Needed:

Customer complaints often highlight gaps in billing accuracy or network performance. This dashboard helps RA teams identify recurring issues, assess their financial impact, and implement measures to improve customer satisfaction and revenue assurance processes.

6. Network Performance Dashboard

Metrics Included:

  • Call drop rates and their financial impact
  • SMS delivery success rates
  • Data session completion rates
  • Alerts for network element failures (e.g.,SMS-C, MSC, SGSN, GGSN)

Why It’s Needed:

Technical issues in the network can lead to unbilled usage and lost revenue. This dashboard provides visibility into network performance, allowing RA teams to collaborate with technical departments to resolve issues that impact revenue capture.

How S-ONE RA Delivers Exceptional Dashboards

S-ONE RA, powered by advanced machine learning, offers pre-configured and customizable dashboards tailored to the unique needs of telecom operators. Here’s how it stands out:

Real-Time Data Integration

S-ONE RA seamlessly integrates with mediation systems, billing platforms, and network data sources to provide comprehensive, real-time insights.

AI-Driven Anomaly Detection

Machine learning algorithms continuously analyze data streams to detect and highlight anomalies, enabling proactive resolution of issues.

Customizable Dashboards

Operators can customize dashboards to focus on their specific priorities, such as high-value customers or roaming revenue analysis.

Automated Reporting

Dashboards include automated reporting features that generate summaries for stakeholders, complete with visualizations and actionable recommendations.

Dashboards include automated reporting features that generate summaries for stakeholders, complete with visualizations and actionable recommendations.

Download our S-ONE RA brochure to discover more about the solution to unlock the full potentiel of our dashbords 

Conclusion

Dashboards are indispensable tools for revenue assurance teams, offering clarity, control, and actionable insights to safeguard revenue and enhance operational efficiency. With S-ONE RA’s advanced dashboards, telecom operators gain the power to monitor critical metrics, identify revenue leakage, and drive sustainable growth.

For a live demonstration of S-ONE RA’s capabilities, including its powerful dashboards, contact us today and see how we can transform your revenue assurance processes.

Ensuring Accuracy in Data Records Reconciliation between CGSN and IN for 2G/3G and 4G Networks

Ensuring Accuracy in Data Records Reconciliation between CGSN and IN for 2G/3G and 4G Networks

Introduction

In the telecom industry, data usage records are logged by various network nodes, such as SGSN/GGSN in 2G/3G networks and SGW/PGW in 4G networks. These records, known as data session EDRs (Event Detail Records), capture critical information about data sessions, including the volume of data used, session duration, and charging details. Meanwhile, the Intelligent Network (IN) records the billing details associated with these data sessions. Reconciliation between these two sources is essential to ensure accuracy in billing, revenue assurance, and network management. In this blog post, we will explore the importance of reconciling these data records, the challenges involved, and how Big Data tools like Apache Spark can streamline this process.

Why Data Records Reconciliation is Important

  1. Accuracy in Data Billing: Each data session, whether in a 2G/3G or 4G network, must be accurately billed to the customer. Discrepancies between the volume of data recorded by the CGSN and the charges recorded by the IN can lead to billing errors, causing revenue loss and customer dissatisfaction.
  2. Revenue Assurance: Ensuring that all data usage is correctly captured and billed is crucial for preventing revenue leakage. Reconciliation helps identify missing, duplicated, or incorrect records, allowing operators to correct discrepancies proactively.
  3. Network Performance Monitoring: Reconciliation can also provide insights into network performance by comparing the expected usage (as recorded by SGSN/GGSN or SGW/PGW) with the actual charges. This helps operators in network planning and optimization.

How to Achieve Data Records Reconciliation

  1. Matching Using MSISDN, IMSI, and Timestamp:
  • MSISDN and IMSI are unique subscriber identifiers that link data sessions across network and billing systems.
  • The timestamp is a crucial attribute that captures the start and end times of a session. Matching records based on MSISDN, IMSI, and timestamp helps in accurately linking data usage records from CGSN and IN.
  1. Using a Unique Correlation ID:
  • Some systems generate a unique correlation ID for each data session, linking records between the network and billing nodes seamlessly. This ID makes reconciliation straightforward by directly associating each data session with its corresponding billing record.
  • However, in many instances, this unique ID is not available, complicating the reconciliation process.

Challenges in Data Records Reconciliation

  1. Absence of a Unique Correlation ID:
  • When there is no unique ID linking records between CGSN and IN, operators must rely on MSISDN, IMSI, and timestamp for matching. This approach is prone to errors, especially when dealing with sessions that start and stop frequently or overlap.
  1. Time Synchronization Issues:
  • Even a minor time discrepancy between SGSN/GGSN (or SGW/PGW) and IN can lead to unmatched records. These discrepancies can arise due to differences in system clocks, network delays, or processing times.
  • To address this, operators often use a time window to match records, where sessions are considered correlated if their timestamps fall within a predefined range, such as ±10 seconds.
  1. Handling High Volumes of Intermediate Records:
  • Data sessions often generate multiple intermediate records, especially during long or fragmented sessions. These records need to be consolidated into a single session record before reconciliation.
  • For 4G networks, SGW/PGW may generate separate records for different parts of a session, further complicating the consolidation process.

Leveraging Big Data Tools for Efficient Reconciliation

  1. Using Apache Spark:
  • Apache Spark’s distributed processing capabilities are ideal for handling large volumes of data records from both CGSN and IN. It allows for efficient matching of records based on multiple keys like MSISDN, IMSI, and timestamp.
  • Spark’s in-memory processing reduces latency, enabling near real-time reconciliation, which is critical for maintaining billing accuracy and revenue assurance.
  1. Consolidating Intermediate Records:
  • Spark can aggregate multiple intermediate records into a single session based on MSISDN and IMSI, while applying business rules to filter out duplicates and handle overlaps.
  • For example, all records with the same MSISDN and IMSI within a session can be grouped together, and their data volume and duration summed to create a consolidated record.
  1. Handling Time Differences:
  • Spark’s window functions allow for flexible time-based grouping and aggregation. A time window can be defined to match records with slight timestamp differences, accounting for system clock discrepancies between CGSN and IN.
  • This helps in accurately correlating records, even when exact timestamps do not match.
  1. Scaling with Data Growth:
  • As data usage continues to grow, the volume of EDRs from SGSN/GGSN and SGW/PGW increases exponentially. Spark’s ability to scale horizontally by adding more nodes to the cluster ensures that reconciliation processes can keep pace with the growing data volumes without compromising performance.

Conclusion

Reconciliation of data records between SGSN/GGSN (or SGW/PGW) and IN is crucial for accurate billing, revenue assurance, and network management. Despite the challenges such as the absence of a unique correlation ID, time synchronization issues, and high volumes of intermediate records, big data tools like Apache Spark provide a robust solution. Spark’s distributed processing, in-memory computation, and advanced aggregation capabilities enable efficient and scalable reconciliation, ensuring data integrity and billing accuracy.

In the next blog post, we will provide a step-by-step guide on implementing a Spark-based data records reconciliation pipeline, complete with code examples and best practices. Stay tuned.